
Climate
As the variations in temperature and precipitation in the Arctic are large, it is most practical to relate to average values, but extremes can occur in both directions. To be able to speak about climate in a meaningful manner, the various weather observations must be measured and standardised. These are called normals. A normal value is the average value of a weather measurement (e.g. temperature or precipitation) over a given period. In Norway, and elsewhere in the world, the average of the weather in the years 1961-1990 is designated as the last and valid normal period. As the Arctic has few inhabitants, there are no precise weather measurements for the whole region, but Svalbard is one of the areas where weather observations have been made over a long period. They show that Svalbard Airport has an average annual precipi-tation of 190 millimetres and an average annual temperature of -6.7 °C.
Did you know...
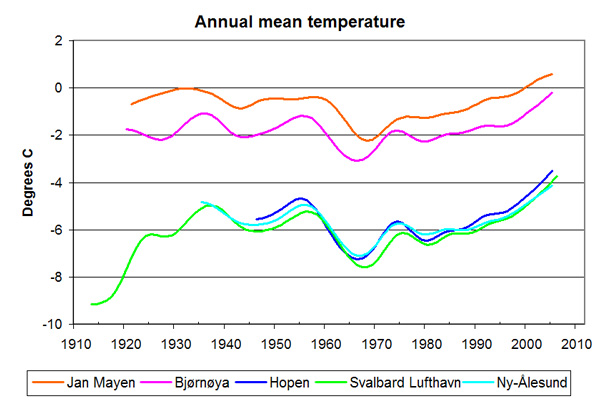 The graph shows the annual mean temperature at some Arctic weather stations. On the whole, the mean temperatures on Jan Mayen and Bjørnøya are higher than those at stations further north, Hopen, Svalbard Airport and Ny-Ålesund. It is nevertheless worth noting that the mean temperature at all the stations is under 0 °C. In other words, if you add together all the temperatures throughout the year and divide by the number of days, the sum is a negative value. The graph shows the annual mean temperature at some Arctic weather stations. On the whole, the mean temperatures on Jan Mayen and Bjørnøya are higher than those at stations further north, Hopen, Svalbard Airport and Ny-Ålesund. It is nevertheless worth noting that the mean temperature at all the stations is under 0 °C. In other words, if you add together all the temperatures throughout the year and divide by the number of days, the sum is a negative value.Illustration: Miljøstatus Svalbard, NPI |
   |

 The lowest temperature measured at Svalbard Airport is -46.3 °C, measured in March 1986; the average for March is -15.7 °C. For comparison, the lowest temperature in March in Tromsø is -14.3 °C measured in 1978 (average -2.3 °C), Trondheim -12.0 °C measured in 1981 (average +0.1 °C), Bergen -7.0 °C measured in 1965 (average +2.3 °C) and Oslo -15.2 °C measured in 1987 (average -0.2 °C).